When was the last time you launched a product based on what your team thought users wanted, only to realize too late they didn’t care?
That gap between what your team assumes and what your users do is where data-driven design matters.
Data-driven design means using real data to guide every decision in your product design process. Instead of relying on opinions, gut feelings, or outdated best practices, you base your decisions on user behavior, feedback, and performance metrics.
Every color, button, feature, and flow is backed by evidence, not guesswork.
It’s a design approach that treats user actions as the source of truth. You track how people interact with your product, identify patterns, run usability tests, listen to feedback, and feed those insights into product development.
Over time, this creates a loop: real usage informs design, design drives better usage, and improved usage leads to better business outcomes.
For SaaS teams, startup founders, and Web3 builders operating in fast-paced environments, this isn’t optional. It’s how you build products that users not only try but also continue to use.
Data-Driven vs. Traditional Design Approaches
Most teams still default to traditional design. You wireframe based on stakeholder input, copy what competitors are doing, polish with a few design tweaks, then ship and hope it sticks. But that approach comes with real limitations.
Traditional Design Falls Short
Traditional design is based on assumptions. Stakeholders guess what users need. Designers follow trends. Feedback comes in late, after launch. If the product flops, you’re left reacting, not improving.
This approach is slow to adapt. You rely too much on experience and intuition, which can be wrong. You miss what users struggle with. And when issues arise, you lack the data to explain or resolve them quickly.
Data-Driven Design Gives You Leverage
A data-driven approach doesn't just provide answers; it empowers your team to make informed decisions. It starts with questions like:
- What are users doing?
- Where do they drop off?
- What’s frustrating them?
With data as your guide, you're not just guessing; you're in control, making informed decisions that lead to better outcomes.
You use analytics tools to track real behavior. You run usability tests. You gather feedback continuously. Then, you feed that data back into your design process before you ship.
You measure bounce rate, session duration, conversion rates, and satisfaction scores. You make product decisions based on evidence.
The result? You reduce risk. You spot issues before they scale. You build things users use.
And over time, you build trust, not just with your users, but across your team. Everyone’s aligned around the same goal: improving real outcomes, not chasing opinions.
When to Use Each
If you’re at an early concept stage with no users or data, you’ll have to rely on experience and qualitative inputs. That’s fine for now.
However, once you have traffic, usage, and feedback, sticking to traditional methods becomes a liability. Every decision you make without data costs you insight, and that is your edge.
Use traditional methods to spark ideas. Use data-driven design to shape and ship what works.
Start with instincts. Scale with evidence.
What is the Principle of Data-Driven Design?
The core principle of data-driven design is simple: let real user data guide product decisions.
Every decision you make from layout to feature priority to microcopy - is rooted in how users behave, not how you think they’ll behave.
Instead of guessing, you ask:
- What does the data say?
- What are users trying to do?
- Where are they dropping off?
You measure before you build. You test before you scale. You prioritize based on what improves user satisfaction, not stakeholder opinions.
This principle shifts the focus from “what looks good” to “what works better.” You move from subjective judgment to measurable impact, transforming your design process and ensuring that every decision is rooted in real user data.
The design process becomes a loop:
- Observe behavior through analytics, feedback, and usability tests
- Identify friction using metrics like bounce rate, click paths, or feature usage
- Make adjustments backed by evidence
- Measure results to see what improves
- Repeat
In short, the principle of data-driven design is about utilizing data to minimize waste, enhance usability, and create products that evolve alongside your users. It’s not about being robotic; it’s about being responsive.
What are the Key Benefits of Data-Driven Product Design
You Build a Better User Experience
You’re not designing for personas or assumptions. You’re designing based on how people use your product. You spot what confuses them. You fix what slows them down. You remove the guesswork and make choices that improve the real experience, not just the visual one.
You Improve Conversions
When you know where people drop off, you know where to focus your efforts. Data shows you what’s working and what’s leaking users. You tweak layouts, flows, or messaging based on actual behavior, and you watch the numbers shift. Not because you hoped it would work. Because you knew it would.
You Waste Less
Bad design decisions are expensive. Features that no one uses redesigns that don’t solve the problem, and launches that fall flat all cost time and trust. Data enables you to catch problems before they escalate. You test early. You validate ideas. You reduce the risk of investing in the wrong thing.
You Prioritize What Matters
Everyone has opinions: founders, marketers, designers, and investors. However, only user behavior reveals what truly matters. You use that to push back, to focus, to choose which feature to build next.
What issue to solve first?
What’s noise, and what’s blocking growth?
How to Implement Data-Driven Product Design
1. Start with Goals You Can Measure
Don’t just say you want “better UX” or “higher engagement.”
Define what success looks like.
Is it reducing the bounce rate?
Increasing signups?
Improving task completion time?
Set clear KPIs that provide your team with a focus and a way to measure progress.
2. Gather the Right Data—Both Quantitative and Qualitative
You need numbers and context. Utilize tools like Mixpanel, Hotjar, or GA4 to monitor user behavior.
Pair that with interviews, surveys, and support tickets to gain a deeper understanding of why they do it. The data is only helpful if it connects behavior with motivation.
3. Look for What’s Broken
Don’t just collect data, analyze it.
Where are users stuck?
What features go unused?
What are they complaining about?
The goal isn’t to confirm your ideas. It’s to surface what users are trying to do and what’s getting in their way.
4. Design Based on What You’ve Learned
Use what you found to shape your next iteration. Don’t skip straight to solutions. Build prototypes that directly address pain points. Keep it focused. Design what solves the actual problem, not what looks impressive on a pitch deck.
5. Test With Real People. Rerun. Repeat.
Ship small. Test often. Watch users interact with your design. Ask questions. Track changes in key metrics. Every test is a chance to learn. Every iteration gets you closer to a product that works better for your users and your business.
What Are Data-Driven Learning Techniques?
These are methods you use to learn from user behavior, so every decision is backed by how people use your product, not what your team thinks they’ll do.
A/B Testing and Multivariate Testing
Run controlled experiments. Show version A to one group and version B to another. Measure the difference. Use it to decide which version performs better. If you’ve multiple variables, such as different headlines and button colors, you test them together. This tells you what’s moving the needle, not what’s just noise.
Cohort Analysis and User Segmentation
Not all users behave the same. Group them by signup date, traffic source, or actions they’ve taken. Then, compare how different cohorts engage, convert, or churn over time. You’ll see patterns you’d miss if you looked at averages. This helps you spot drop-offs, repeat behaviors, or sticky features.
Funnel Analysis and Conversion Optimization
Map out your user journey, from landing page to signup to activation.
Where are people bouncing?
Where are they converting?
Funnel analysis reveals which step in your process requires improvement. You optimize based on facts, not hunches. Less guessing. More progress.
All of these are tools to help you learn faster and build smarter. You don’t need to run all of them at once. Start with the one that helps answer your biggest question right now.
Tools and Technologies
You don’t need 20 tools; you need the right stack that helps you collect, analyze, and act on user data. These are battle-tested by product teams that build fast and learn even faster.
Analytics and Data Collection Tools
You can’t build what users need if you don’t know how they behave. The right tools help you stop guessing and start seeing exactly what’s happening, who’s dropping off, what’s converting, and where friction lives.
Web Analytics
These tools show you traffic, bounce rates, and conversion trends. Think of them as the pulse check for your product.
- Google Analytics (GA4) – Free powerful, but with a learning curve. Best for tracking traffic across marketing and product.
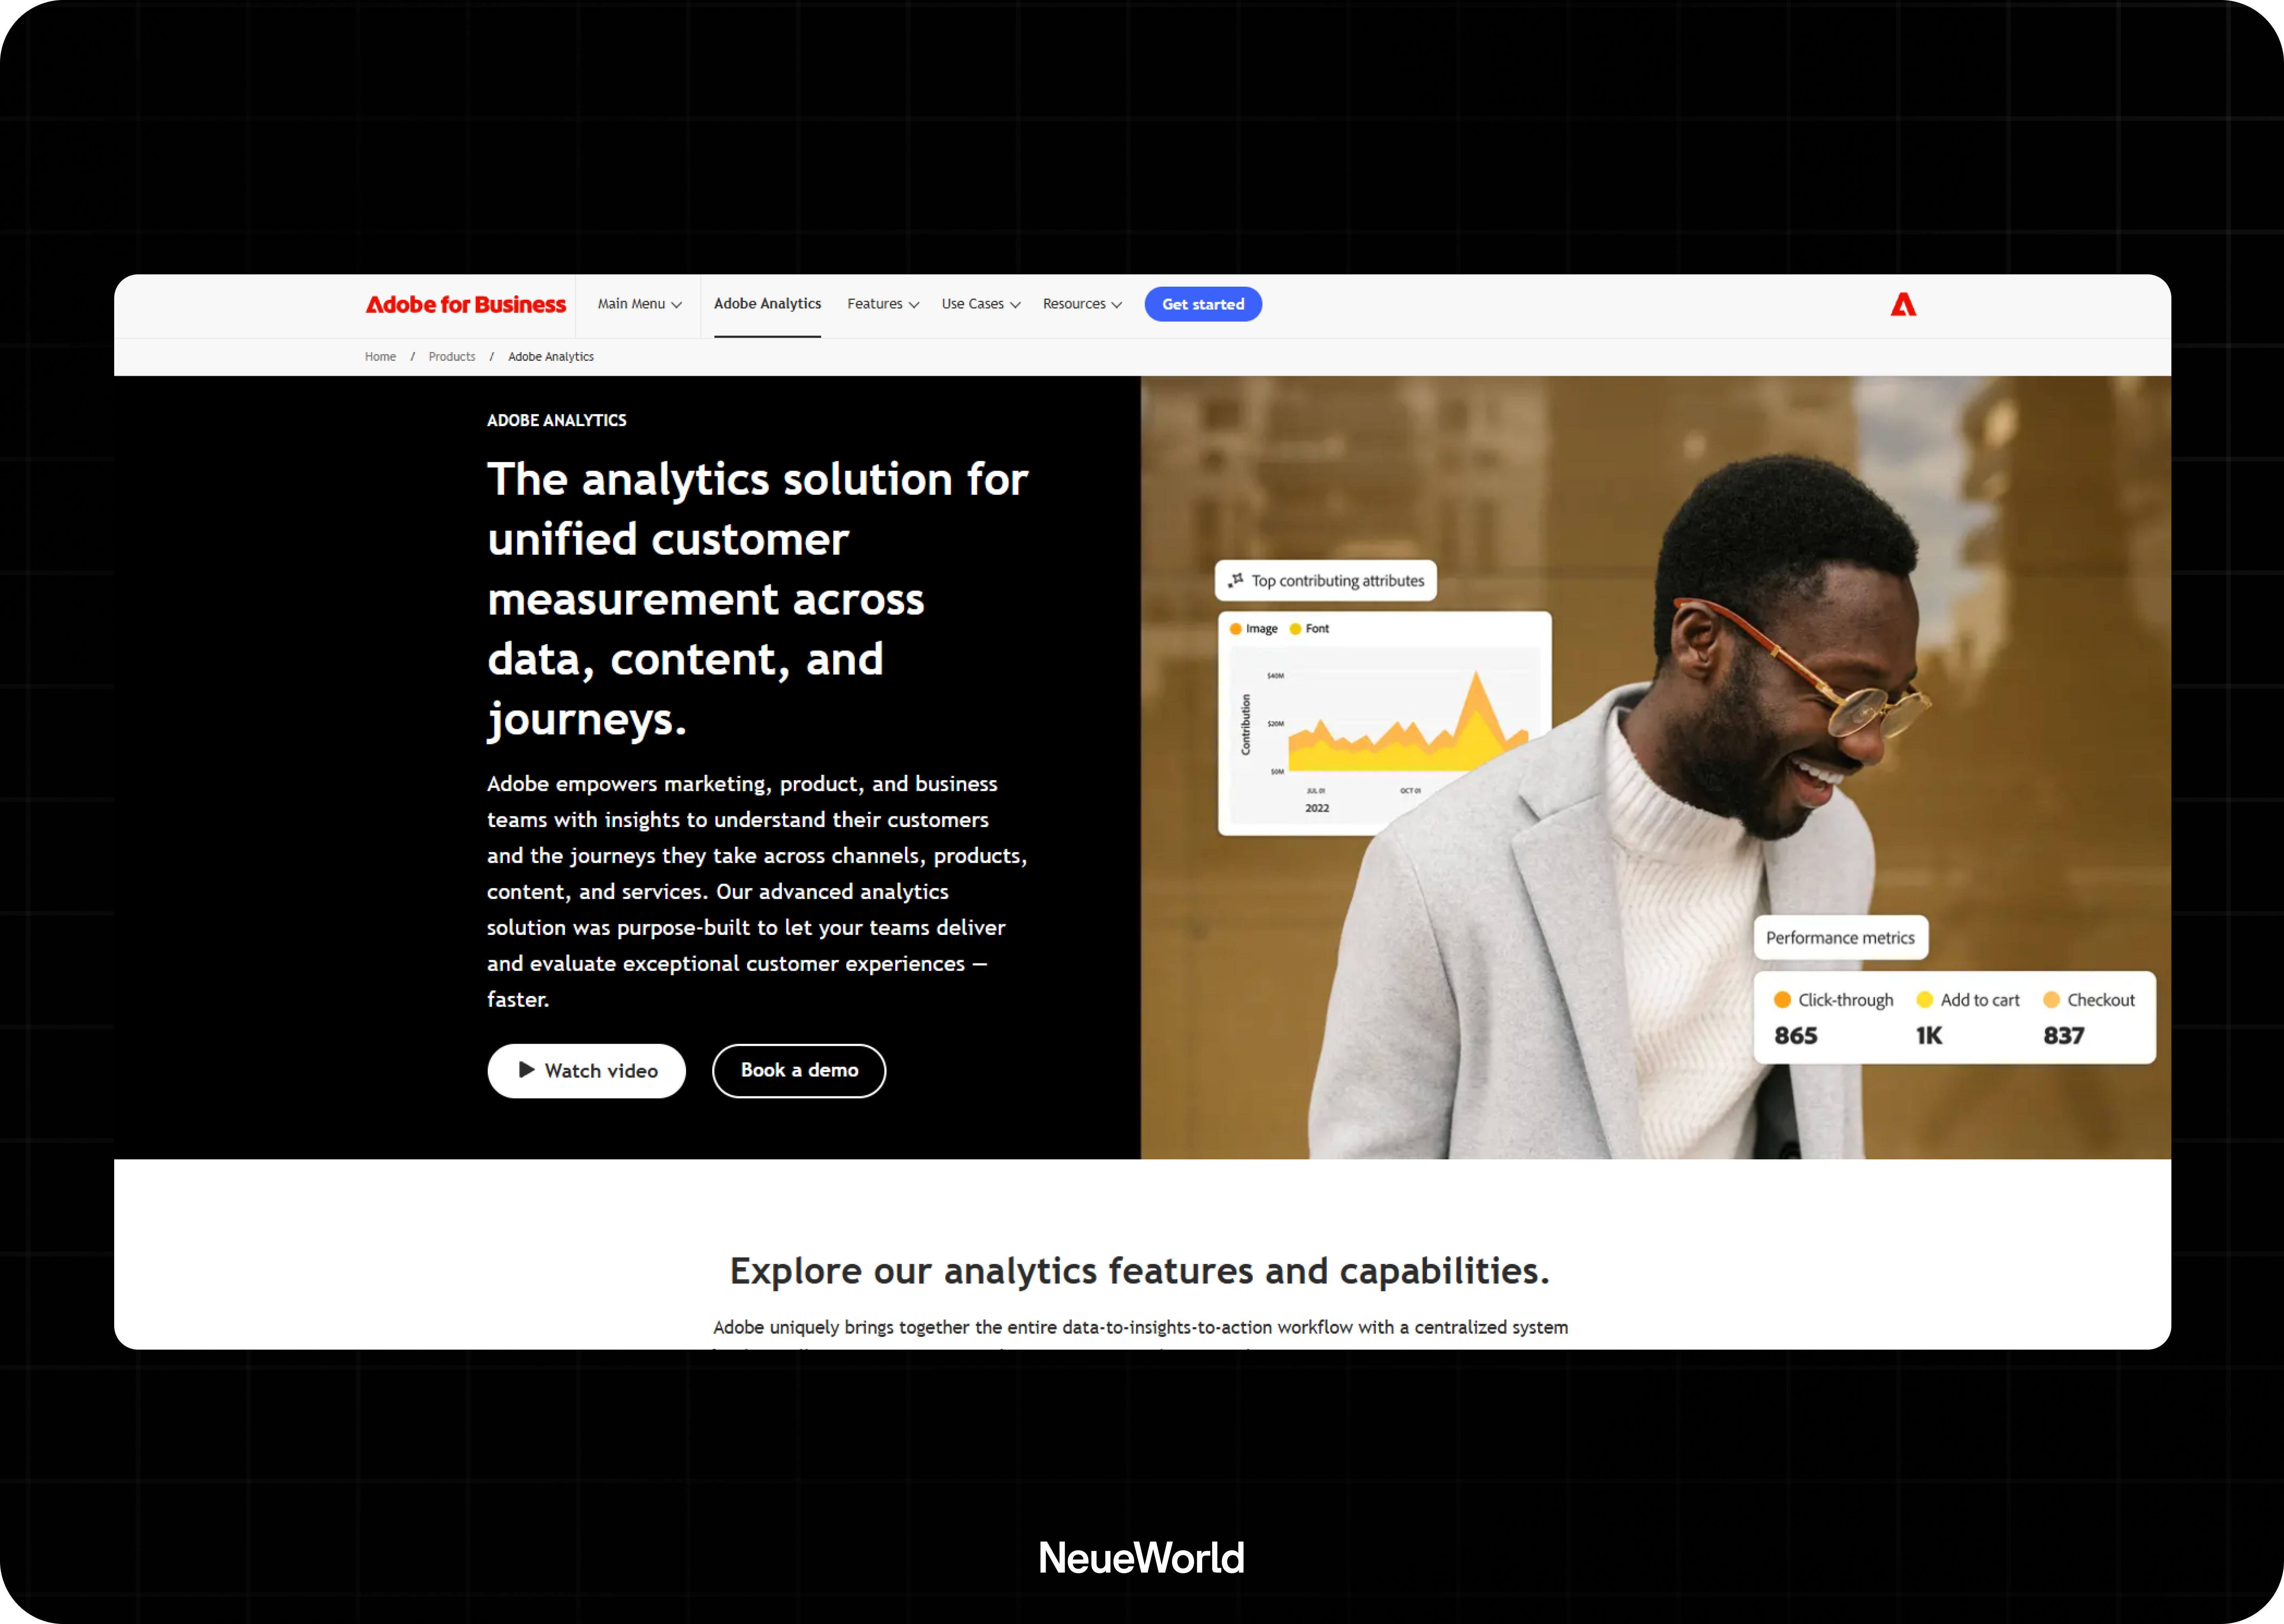
- Adobe Analytics – Enterprise-grade, often overkill for startups.
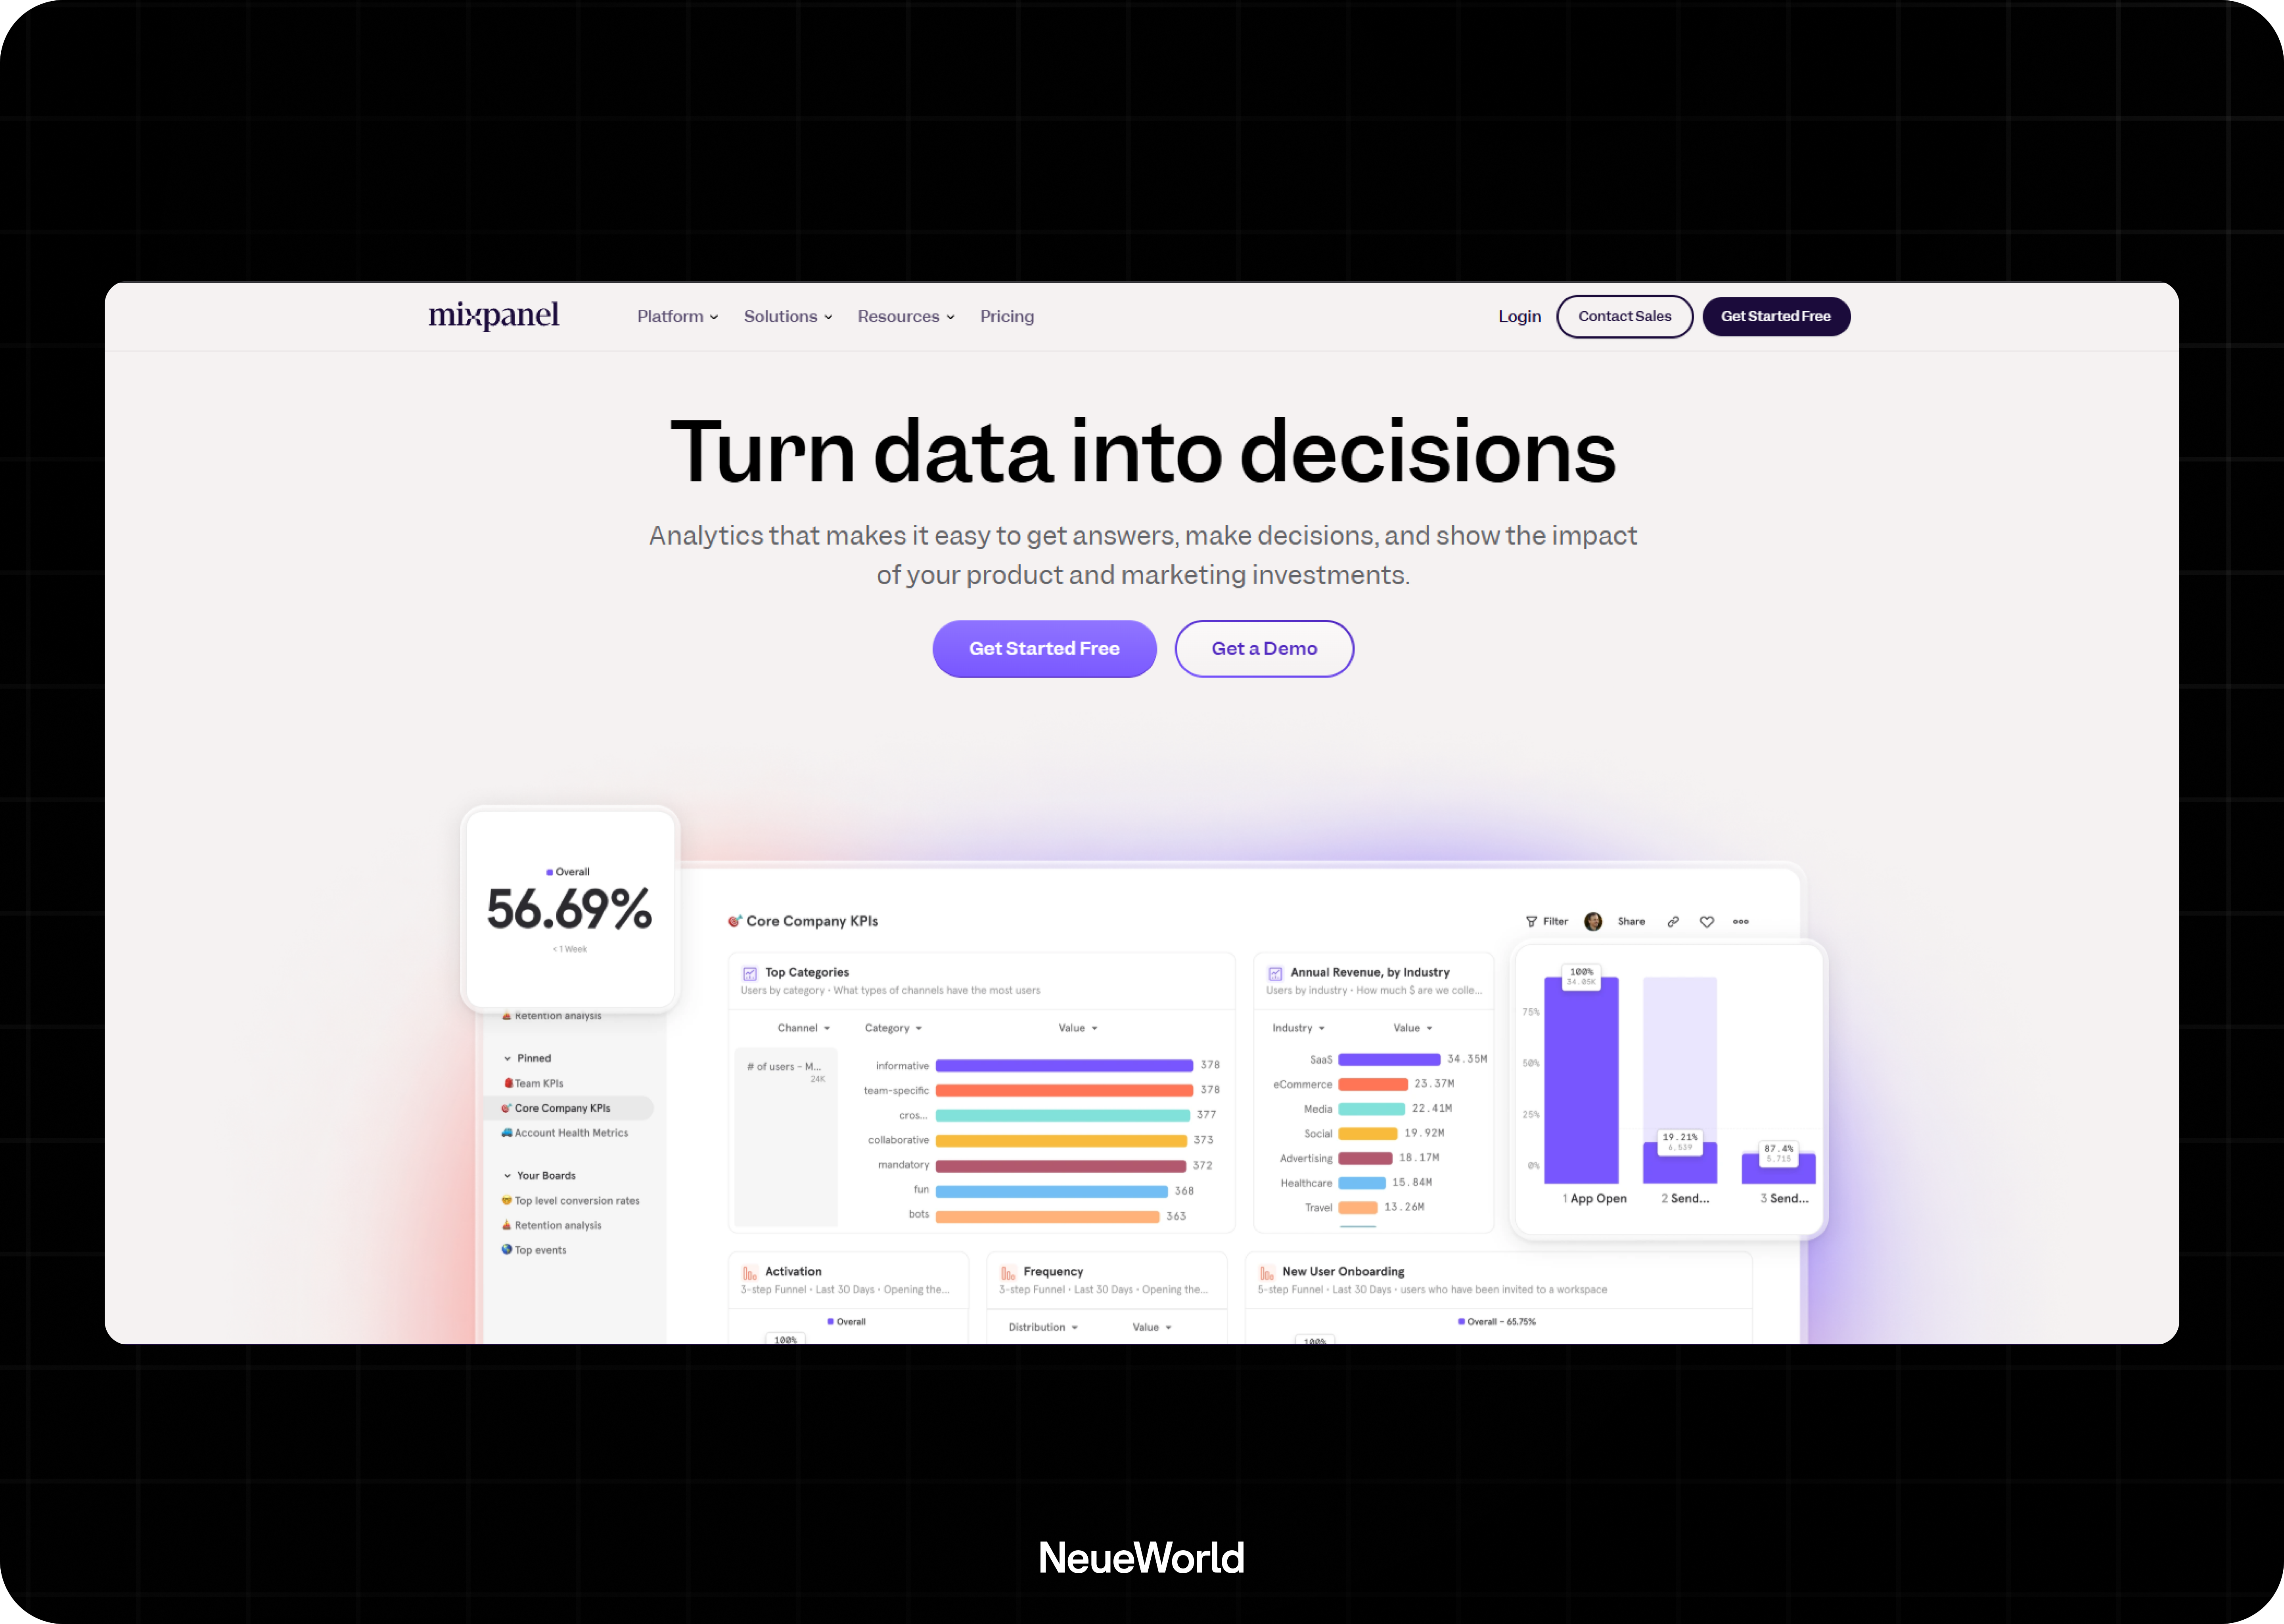
- Mixpanel – Built for product analytics. Tracks events, funnels, and retention without drowning you in vanity metrics.
User Behavior Tracking
Seeing how users interact with your product provides context that dashboards alone can’t.
- Hotjar – Heatmaps, scroll depth, and session recordings. Good for identifying confusion points on key screens.
- FullStory – More advanced replay with error tracking and dev-friendly features.
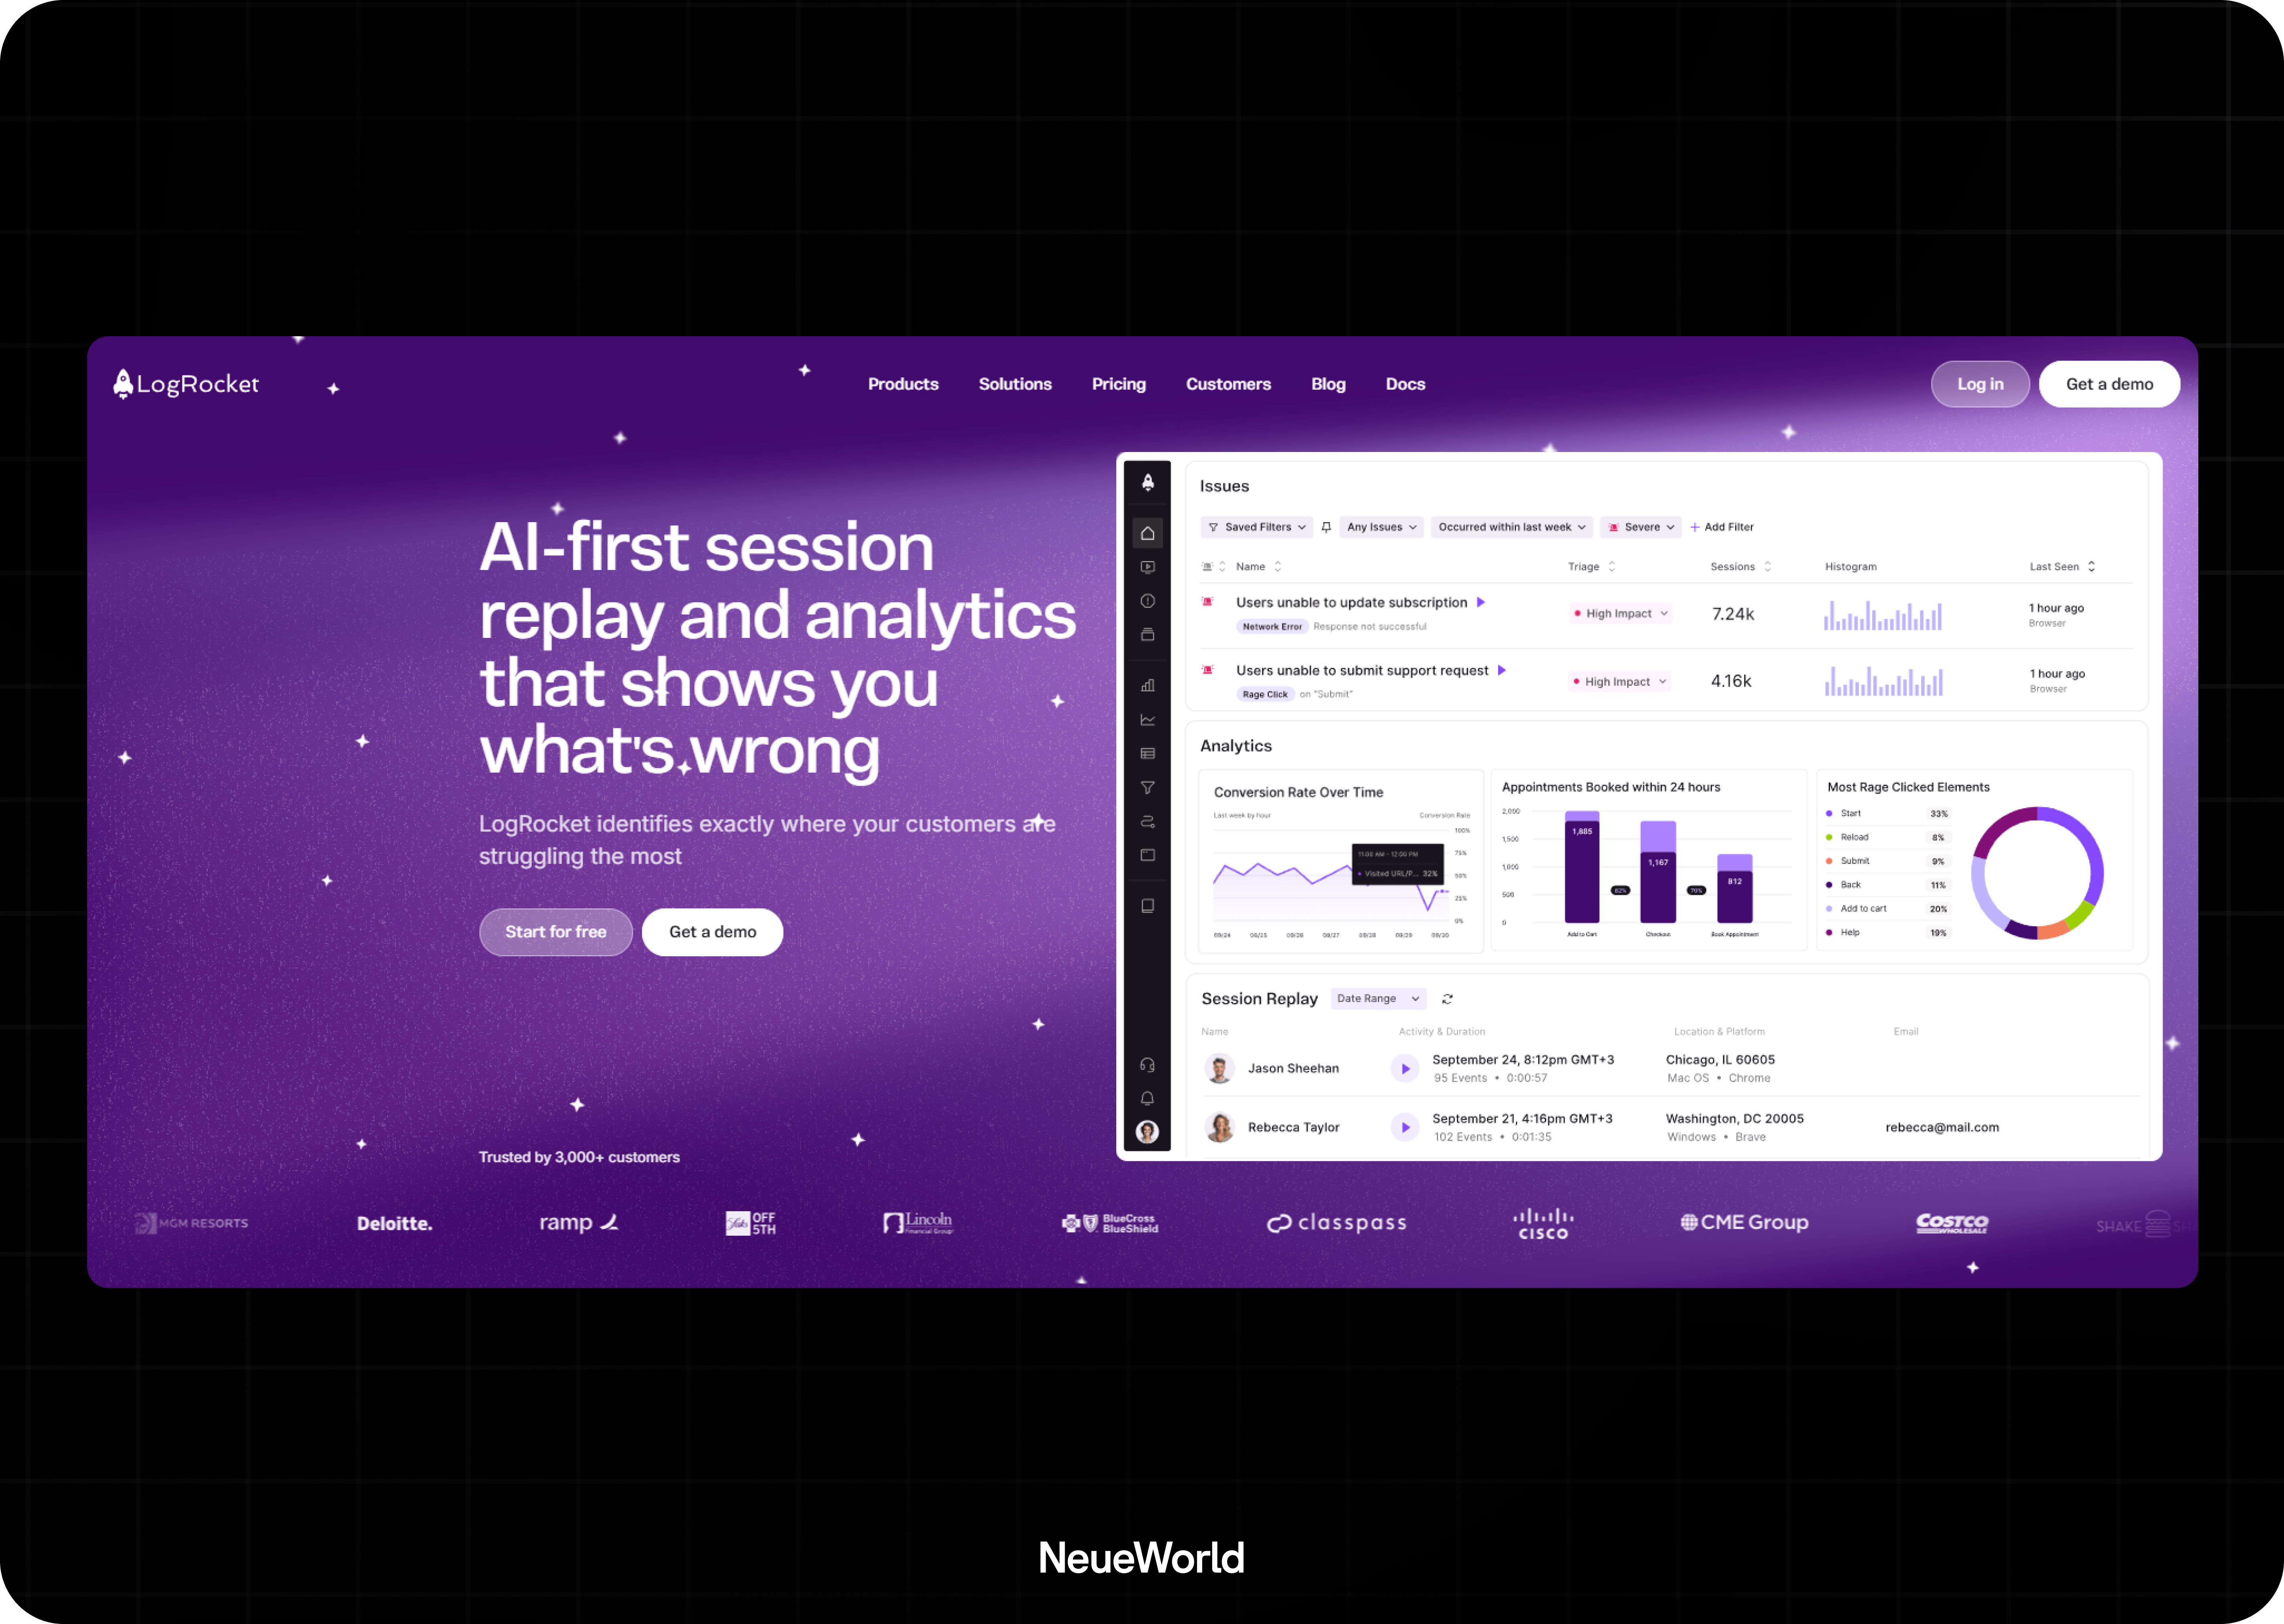
- LogRocket – Combines session replays with console logs. Ideal for teams solving UX and bug-related friction.
A/B Testing Platforms
Use these when you want to test variations and measure impact in real-world scenarios.
.png)
- Optimizely – Full-scale experimentation with robust targeting and analytics.
- VWO – Lightweight alternative focused on A/B testing, heatmaps, and funnels.
- Google Optimize – Was widely used but discontinued in 2023. Most teams have now transitioned to paid options.
Survey and Feedback Tools
Talk to your users. Quantitative data shows what’s happening. Surveys tell you why.
- Typeform – Clean, modern forms. Great for in-product surveys and post-interview follow-ups.
- SurveyMonkey – Long-time favorite for structured feedback and longitudinal studies.
- UserVoice – Prioritize feature requests and feedback at scale. It is beneficial for SaaS with active user bases.
Pick tools that help you answer real product questions. Start lean. Expand as your feedback loops mature. The goal isn’t to collect more data; it’s to collect the correct data.
Design and Prototyping Tools
You don’t need a fancy design stack; you need tools that help you go from insight to interface fast. These are what product teams use to sketch ideas, build flows, and validate before it’s too late to pivot.
Design Platforms
These are your go-to tools for building UI layouts, brand assets, and design systems.
- Figma – The industry standard. Real-time collaboration shared libraries, and community plugins that speed up everything.
- Sketch – Still popular for Mac-first teams, but losing ground. It is better for static designs than full team workflows.
- Adobe XD – Used by Adobe-first teams, though adoption is slowing.
Prototyping
Clickable prototypes help you test assumptions without writing code. Get feedback while ideas are still cheap to change.
- InVision – Once the default, it is now mainly used for basic clickable prototypes.
- Marvel – This is a simple tool for early-stage teams to turn wireframes into flows.
- Principle – Best for advanced UI animations and micro-interactions, especially for mobile.
Collaboration
Your design isn’t the only thing that needs clarity. Ideas, decisions, and feedback need to move just as quickly.
- Miro – Whiteboards for planning user journeys, product roadmaps, and workshops.
- FigJam – Built by Figma, perfect for real-time brainstorming and feedback with design context baked in.
- Notion – Flexible for docs, research, and specs. Use it to keep input and design aligned in one place.
User Testing
No assumptions. These tools help you see what’s working and what’s not before you launch.
- UserTesting – Access real people who test your product while talking through their experience.
- Maze – The test flows directly from Figma. Fast feedback from real users, no dev required.
- Lookback – Remote moderated testing with video and voice. Great for early-stage usability studies.
Start with tools your team can use, not just what’s trending. The right stack should shorten your feedback loop, not add noise. Build, test, fix, repeat.
Common Challenges and How to Overcome Them
1. You’re drowning in data but starved for direction
Analytics dashboards are packed, but no one knows what to look at. This stalls decisions and slows teams down.
What to do: Anchor every design decision to a specific business goal. Define your product goals in terms of 1–2 core metrics that truly matter: activation, retention, conversion, or satisfaction.
Use those metrics as filters, not checklists. Ignore the rest until they’re relevant. Data works best when it serves a straightforward question, not when it floods your thinking.
2. You see the what but not the why
User drop-offs, low engagement, and bounced page data show the outcome, not the cause.
What to do: Pair numbers with real human input. Watch session replays. Run usability interviews. Talk to 5 users before you guess. Data without context leads to wrong calls.
Pair your quantitative tools with qualitative methods: observe user sessions, conduct brief usability interviews, and set up surveys triggered at key points. This blend provides a comprehensive view. Data tells you what’s happening; real users explain why.
3. Your team doesn’t trust the data
Designers trust their instincts. Developers trust their roadmap. Marketers want speed. Data creates friction instead of clarity.
What to do: Share small wins. Show how a UI tweak improved task completion by 12%. Run low-stakes A/B tests and share results in real language, not data jargon. The goal isn’t to convince people data is always right. It’s to show that data helps us see clearly. Once people see it working, they’ll start using it themselves.
4. You don’t have the tools or the people
Startups often lack analysts. No one’s filtering insights from the noise. Tools are often under utilized or improperly configured.
What to do: Start small. Utilize tools like Hotjar or Mixpanel to monitor key actions. Automate
weekly reports. Build internal habits before hiring a data team. Track five key user actions, build weekly reporting rituals, and assign one person to own the insights.
As you grow, consider bringing in a data analyst or product marketer who knows how to connect the dots. Until then, don’t overcomplicate it. Simple, consistent tracking beats complex, unused systems.
5. You’re scared to move without perfect data
Teams delay launches, waiting for more insights. This slows growth and kills momentum.
What to do: Use what you have to make a call, launch a version, and learn from the outcome. Speed matters more than certainty. Each experiment is a chance to refine. The most data-mature teams aren’t the ones with the best dashboards. They’re the ones who make fast, informed bets and iterate relentlessly.
6. Data kills your creativity
You start designing for metrics, not users. Every choice becomes a safe bet. The product feels optimized but soulless.
What to do: Use data to inform, not control. Leave room for instinct, opinion, and risk. Test ideas quickly, but don’t let numbers dominate the conversation. Launch features that don’t yet have a metric. Just make sure you measure what happens next. Creativity backed by feedback is stronger than creativity in a vacuum. But creativity is still the point.
FAQs
What’s the difference between data-driven and data-informed design?
Data-driven means you follow the numbers. Data-informed means you use data to guide you, but you still trust your product instincts.
Can data-driven design stifle creativity?
It can if you let the numbers run everything. However, when used effectively, data enables you to make smarter, not safer, creative decisions.
What kinds of data are most valuable in product design?
Behavior data shows what users do. Feedback shows why they do it. You need both to design things people use.
How do you measure the success of data-driven design?
Examine actual outcomes, including sign-ups, retention rates, and a decrease in complaints. If design changes move the needle, it’s working.